
9 Investigations
9.1 Corneal Topography and Tomography
9.2 Confocal Microscopy
9.3 Optical Coherence Tomography - Macula
9.4 Optical Coherence Tomography Angiography (OCT-A)
9.5 Optical Coherence Tomography - Glaucoma
9.6 Optical Coherence Tomography – Anterior Segment
9.7 Fundus Autofluorescence Imaging
9.8 Fundus Angiography - Fluorescein
9.9 Fundus Angiography - Indocyanine Green
9.10 B-scan Ultrasonography & UBM
9.11 Electrophysiology
9.12 Automated Visual Fields
9.13 Neuroimaging
9.3 Optical Coherence Tomography - Macula
Optical Coherence Tomography (OCT) is a crucial tool for diagnosing and monitoring retinal and glaucomatous disease. It produces cross-sectional images by studying interference patterns formed between infrared light reflected off the retina and a reference beam. Candidates should have an understanding of normal and pathological OCT scans. It is important to appreciate that OCT layers represent reflective interfaces, not true anatomy. High definition spectral domain OCT allows for greater precision in identifying these interfaces than time domain OCT. The addition of colour is artificially introduced and does not add further information than grey-scale scans.
.jpg)
- Figure 9.3.2: Adult Vitelliform Macular Degeneration
- Figure 9.3.3: Best Disease
- Figure 9.3.4: Central Serous Chorioretinopathy
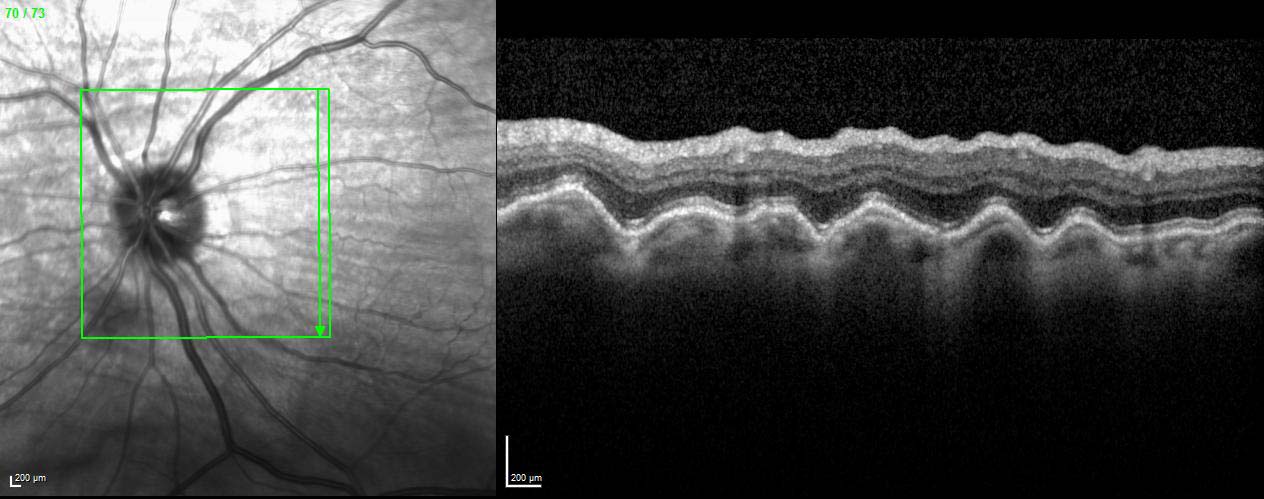
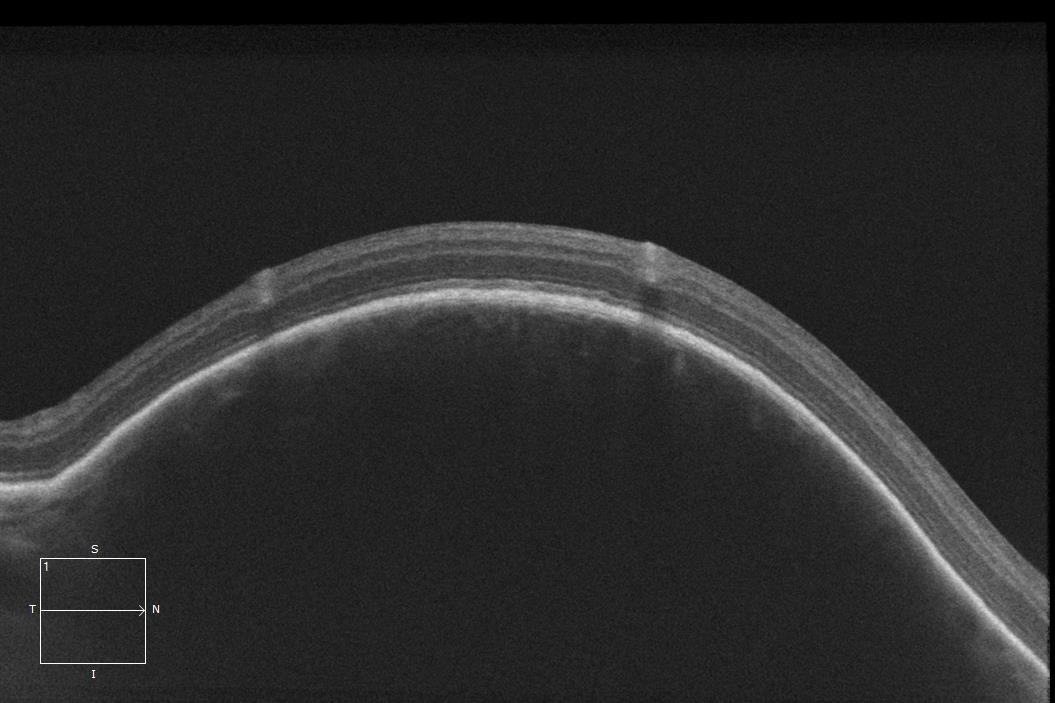
- Figure 9.3.5: Choroidal Folds
- Figure 9.3.6: Choroidal Haemangioma
- Figure 9.3.7: Choroidal Naevus (Amelanotic)
- Figure 9.3.8: Choroidal Naevus (Pigmented)
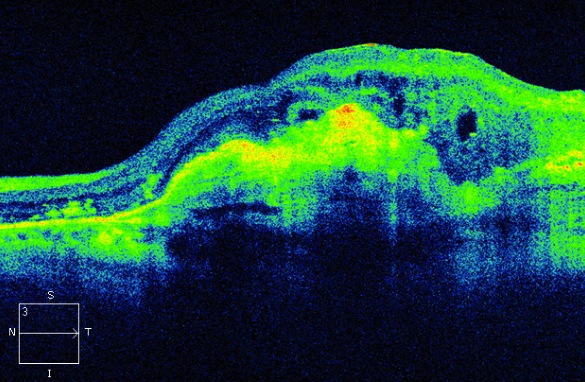
- Figure 9.3.9: Choroidal New Vessel with Fibrovascular Pigment Epithelial Detachment, Outer Retinal Tubulation and Retinal Cysts
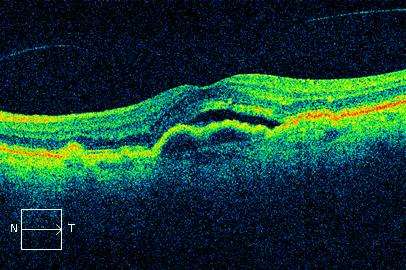
- Figure 9.3.10: Choroidal New Vessel with Pigment Epithelial Detachment and Subretinal Fluid
- Figure 9.3.11: Cystoid Macular Oedema (Gross)
- Figure 9.3.12: Drusenoid Pigment Epithelial Detachment (PED)
- Figure 9.3.13: Enhanced Depth Imaging OCT (EDI-OCT)
- Figure 9.3.14: Epiretinal Membrane with Diffuse Retinal Oedema
- Figure 9.3.15: Full Thickness Macular Hole with Cystoid Macular Oedema and Operculum
- Figure 9.3.16: Geographic Atrophy
- Figure 9.3.17: Hard Exudate and Retinal Oedema
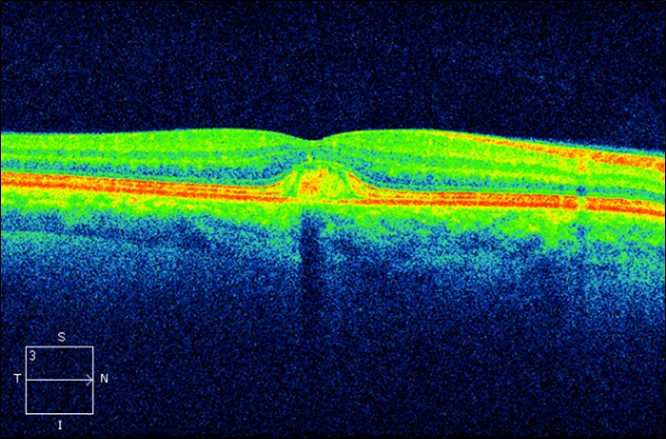
- Figure 9.3.18: Macular Telangiectasia (Type 2) – MACTEL 2
- Figure 9.3.19: OCT Cube
- Figure 9.3.20: Onion Sign
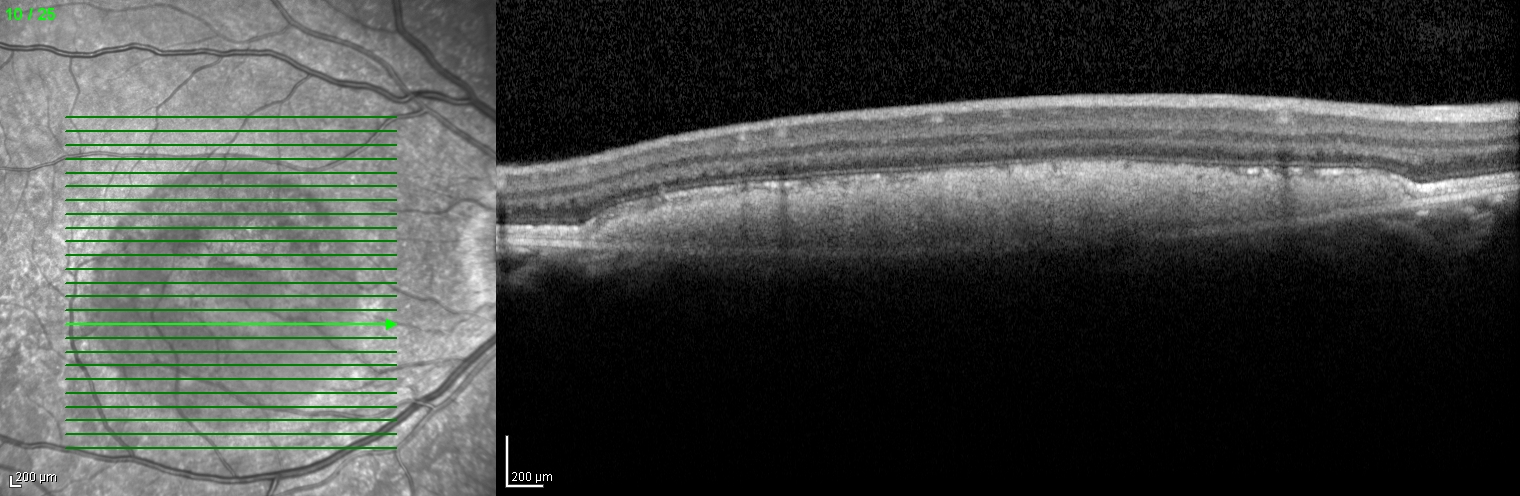
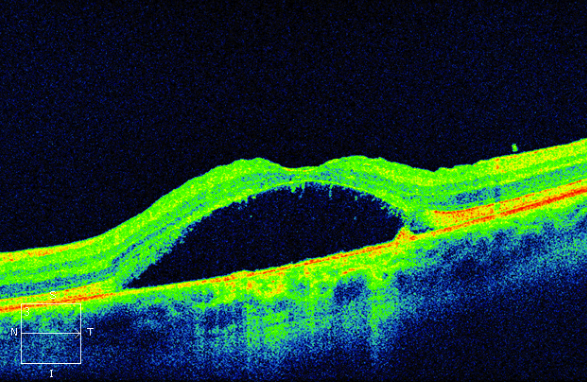
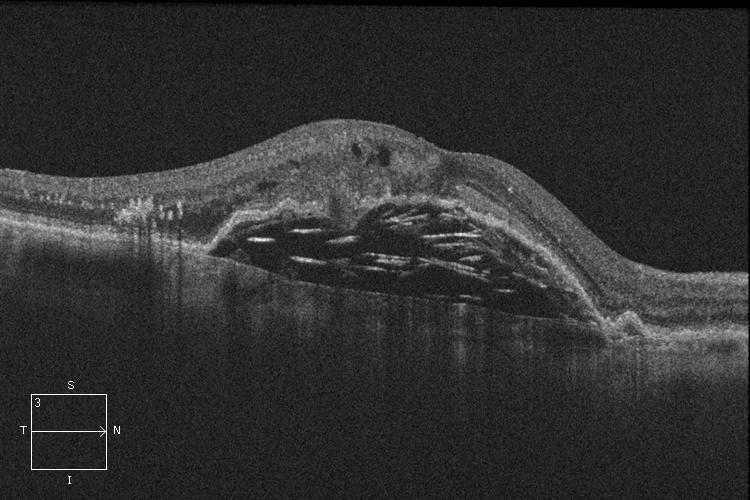
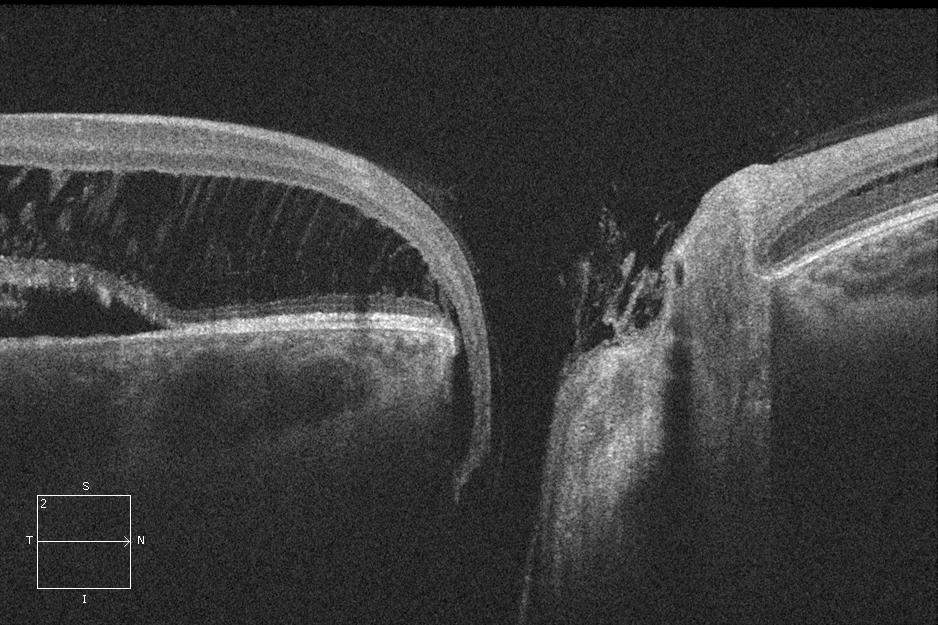
- Figure 9.3.21: Optic Disc Pit Maculopathy
- Figure 9.3.22: Retinal Detachment (Macula Off)
- Figure 9.3.23: Retinal Detachment (Inferior)
- Figure 9.3.24: Retinoschisis
- Figure 9.3.25: Serous Pigment Epithelial Detachment
- Figure 9.3.26: Subhyaloid Haemorrhage
- Figure 9.3.27: Subretinal drusenoid deposits (reticular pseudodrusen)
- Figure 9.3.28: Subretinal Fibrosis
- Figure 9.3.29: Type 3 Choroidal Neovascularisation (RAP lesion)
- Figure 9.3.30: Vitreo-Macular Traction (focal)
- Figure 9.3.31: Vitreomacular traction (focal, with gross retinoschisis and distortion)
.jpg)
.jpg)
.jpg)
.jpg)
.jpg)
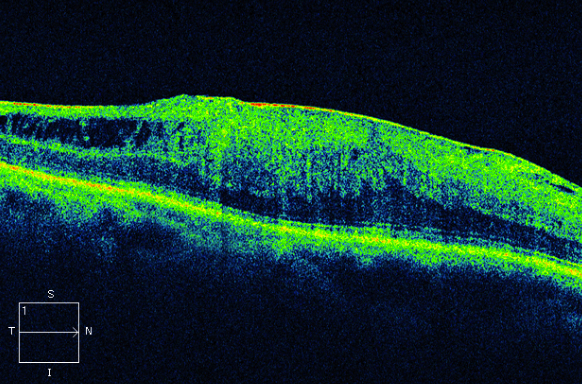
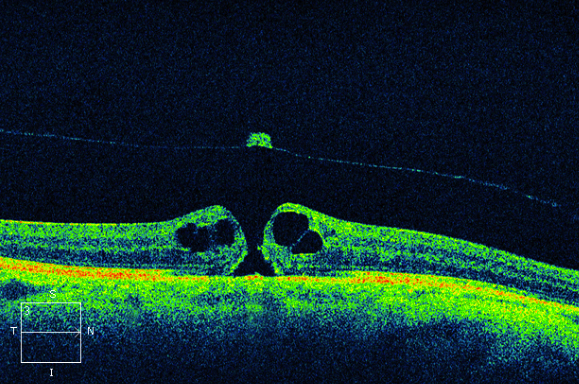
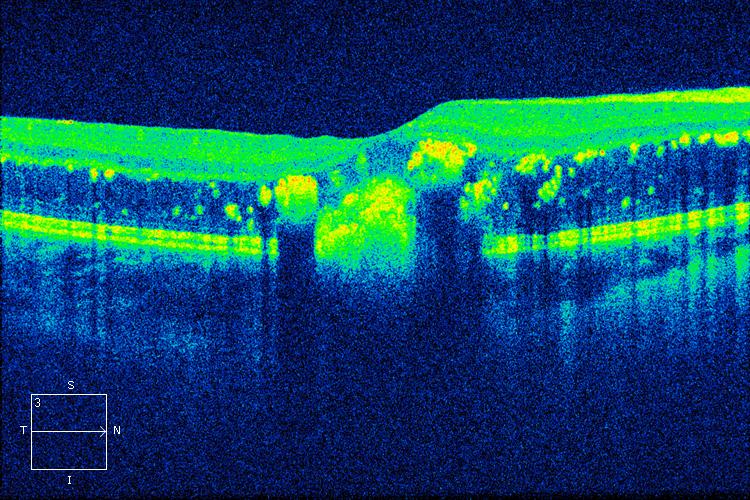
Figure 9.3.17
Hard Exudate and Retinal Oedema
The hyperreflective dots in the outer retina are hard exudate, whereas the hyporeflective expansion of the outer retinal layers represents more diffuse oedema. Hard exudates usually develop in the setting of chronic retinal oedema. These findings are non-specific.
-–-MACTEL-2.jpg)
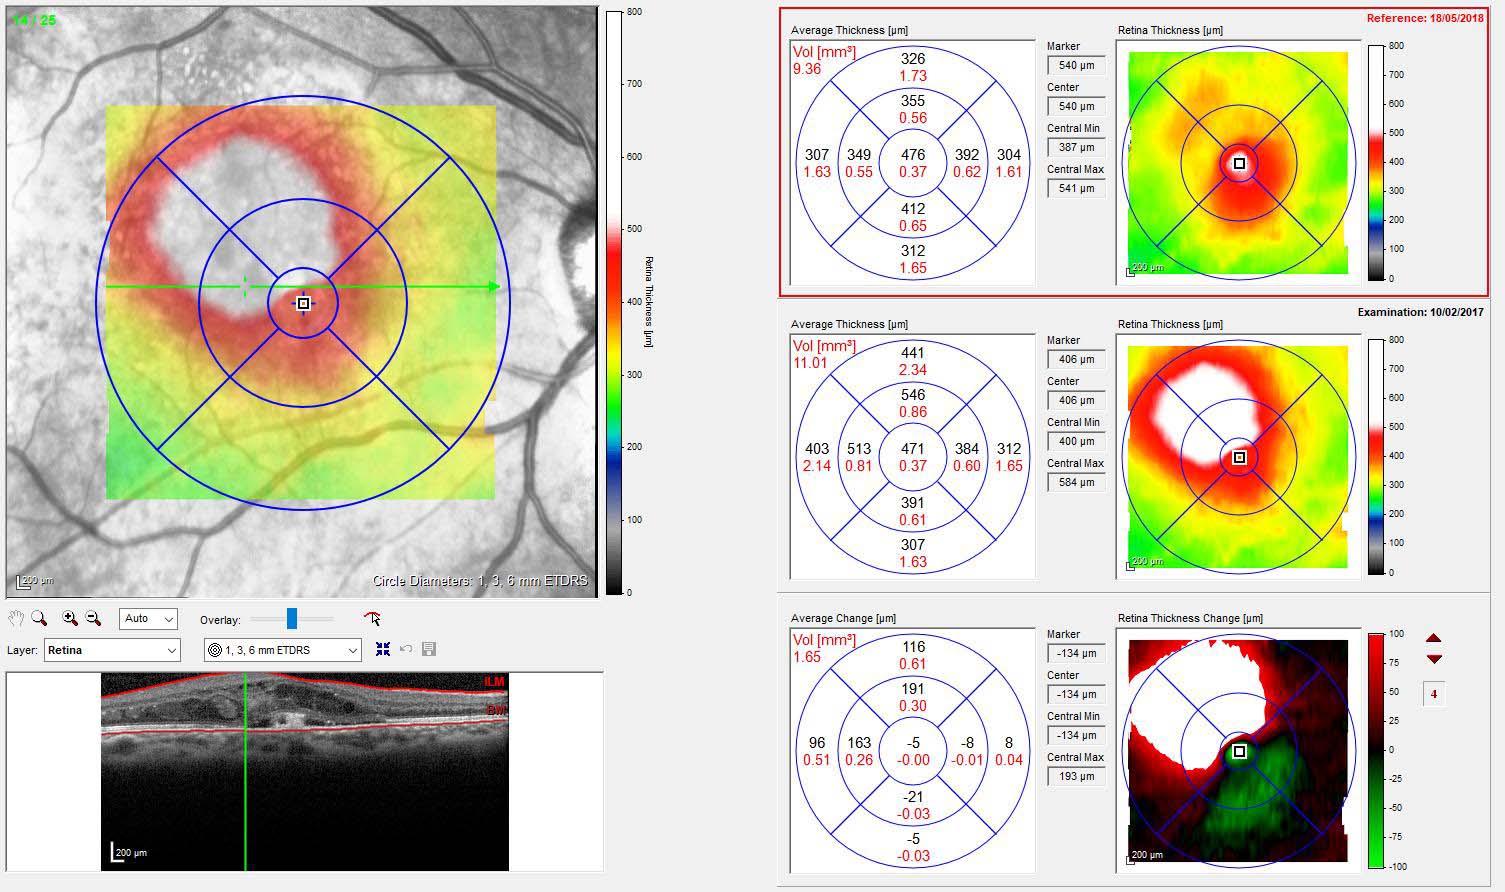
Figure 9.3.19
OCT Cube
Multiple raster images are automatically acquired together and stacked to give information about a volume of retina (the “cube”). This is then displayed as a heat map showing retinal thickness (top left panel). Software-generated segmentation lines for the individual raster slices are shown in the bottom left panel. Software registration of the acquisition allows for the same volume of retina to be imaged at different points in time and compared (as shown in the right panel of three scans of time point A, time point B, and change map A – B).
See Pang et al, The Onion Sign in neovascular age-related macular degeneration represents cholesterol crystals. Ophthalmology. 2015 Nov; 122(11): 2316–2326.
All rights reserved. No part of this publication which includes all images and diagrams may be reproduced, distributed, or transmitted in any form or by any means, including photocopying, recording, or other electronic or mechanical methods, without the prior written permission of the authors, except in the case of brief quotations embodied in critical reviews and certain other noncommercial uses permitted by copyright law.

Vitreoretinal Surgery Online
This open-source textbook provides step-by-step instructions for the full spectrum of vitreoretinal surgical procedures. An international collaboration from over 90 authors worldwide, this text is rich in high quality videos and illustrations.