
9 Investigations
9.1 Corneal Topography and Tomography
9.2 Confocal Microscopy
9.3 Optical Coherence Tomography - Macula
9.4 Optical Coherence Tomography Angiography (OCT-A)
9.5 Optical Coherence Tomography - Glaucoma
9.6 Optical Coherence Tomography – Anterior Segment
9.7 Fundus Autofluorescence Imaging
9.8 Fundus Angiography - Fluorescein
9.9 Fundus Angiography - Indocyanine Green
9.10 B-scan Ultrasonography & UBM
9.11 Electrophysiology
9.12 Automated Visual Fields
9.13 Neuroimaging
9.11 Electrophysiology
The rationale of electrophysiology testing is to provide objective evidence of function at the different levels of the visual system, thus enabling accurate localisation and characterisation of dysfunction in the vast majority of patients. The three main arms of electrophysiological testing are the:
- Electroretinogram (ERG)
- Full field ERG (mass response from photoreceptors and INL)
- Pattern ERG (central retinal ganglion cells (RGC))
- Multifocal ERG (macular cones)
- Electro-oculogram (EOG): RPE
- Visual evoked potential (VEP): Cortical Standardisation of testing is provided by The International Society for Clinical Electrophysiology of Vision (ISCEV).
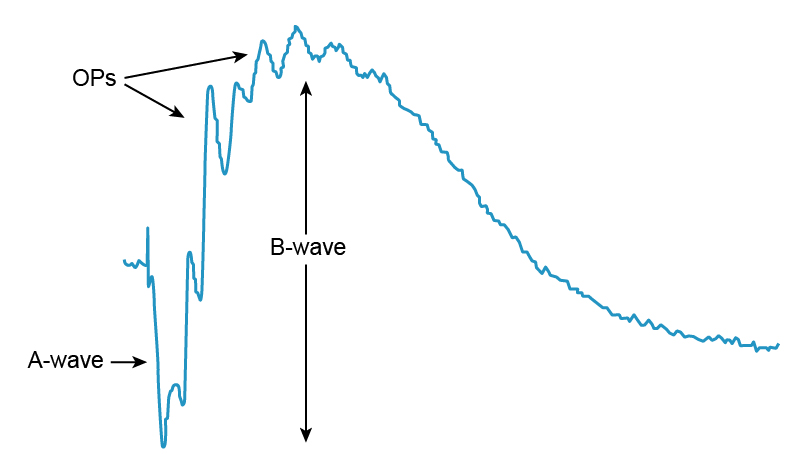
The ERG records the action potential produced by the retina when it is stimulated by light of adequate intensity. In particular, it assesses the photoreceptor and inner nuclear layers of the retina.
Waveforms
There are four types of waveforms:
- a-wave - negative wave which represents photoreceptor activity (rods > cones)
- b-wave - positive wave which is produced by inner retinal activity (ON-bipolar cells, Muller cells)
- oscillatory potentials – are superimposed on the b wave. They are produced by inner plexiform layer activity (amacrine cells)
- c-wave - slow response that originates from the RPE
1. Full Field ERG (ffERG)
- Stimulation of the entire retina with a source of light under varying conditions of retinal adaptation
- Provides a mass response of the retina and is normal in localised macular disease
- No significant retinal ganglion cell (RGC) contribution
- Amplitude reflects quantity of functioning retina
- Implicit time (latency) reflects quality of functioning retina
- General photoreceptor dysfunction will cause decreased amplitude and increased implicit time.
- Focal photoreceptor dysfunction will cause a decrease in amplitude but normal implicit time.
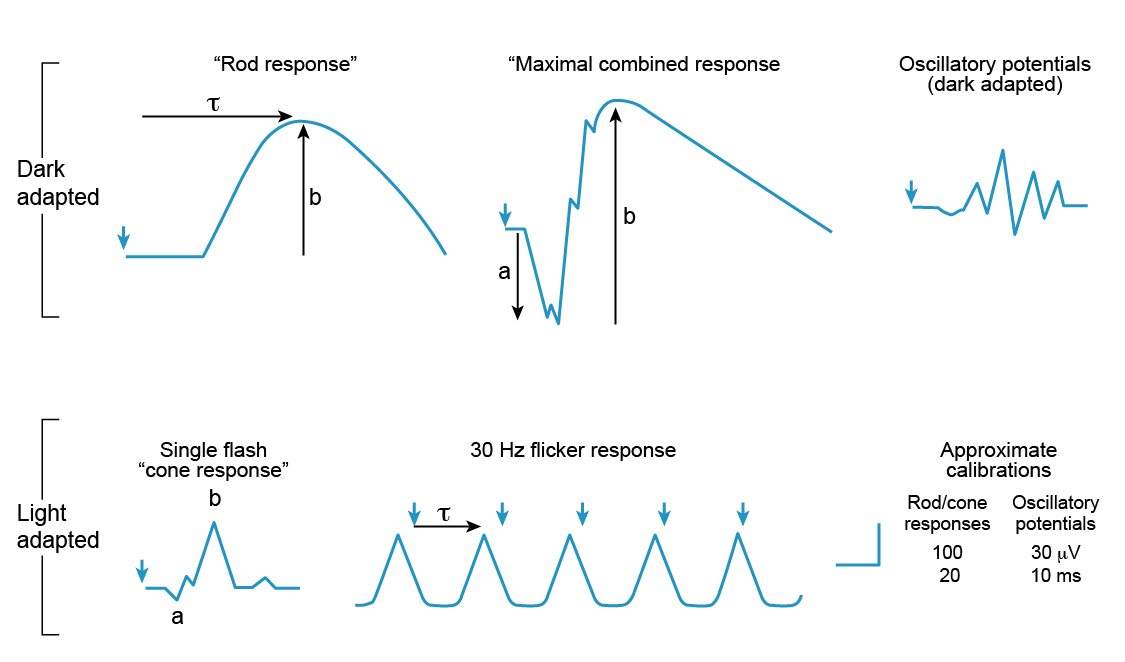
- The full field ERG is performed in scotopic and photopic conditions
- Scotopic (dark adapted) ERG
- Rod driven response (DA 0.01) - Low intensity stimulus
- Maximal combined response (DA 10.0) - High intensity stimulus
- Photopic (light adapted) ERG
- Single flash (LA 3.0) – cone location sensitive
- Flicker ERG (LA 30Hz) – cone specific (but generated at the inner retinal level). Delayed in birdshot chorioretinopathy
- Scotopic (dark adapted) ERG
- The main disadvantage of the full field ERG is that it does not localise the sites of disease activity and provide information on the retinotopic distribution of disease loss
“Negative” ERG
- a-wave spared but selective b-wave reduction
- Due to dysfunction post-phototransduction
- CRAO
- CSNB
- X-linked retinochisis
- Quinine toxicity
- Melanoma associated retinopathy
- Batten disease
- Birdshot chorioretinopathy
- Cone-rod dystrophy (occasionally)
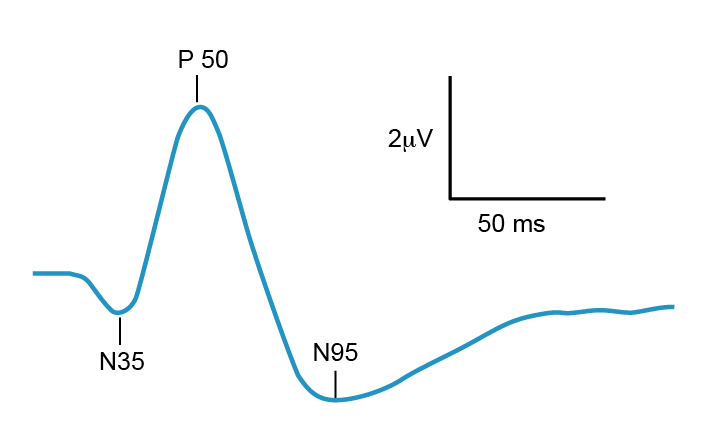
2. Pattern ERG (PERG)
- Provides a measure of central retinal ganglion cell function by using a reverse flickering checkboard stimulus under photopic conditions
- Helps differentiate between macular and optic nerve dysfunction
- The waveforms assessed are:
- N35 – assess photoreceptor function
- P50 – reflects activity distal to the ganglion cells. Typically normal in optic neuropathies
- N95 – generated by ganglion cells. Typically abnormal in optic neuropathies
- An abnormal PERG is seen in cone dystrophies/Stargardts disease. A normal PER suggests that there is central sparing
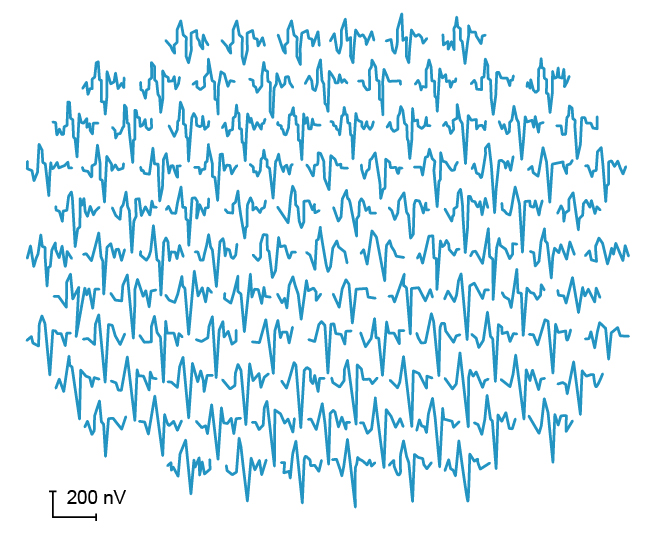
3. Multifocal ERG (mfERG)
- A method of recording macula response spatially by comparing local cone function from different areas of central retina in photopic conditions
- Largely still research based but has clinical value in conditions such as the cone dystrophies, Stargardt disease, retinitis pigmentosa and acute zonal occult outer retinopathy (AZOOR)
The EOG is a measure of the function of the retinal pigment epithelium (RPE) and the interaction between the RPE and the (rod) photoreceptors. It achieves this by calculating the standing potential between the electrically positive cornea and the electrically negative posterior eye. Electrodes are placed at the medial and lateral canthi and the patient is asked to look from side to side in dark then light adaptation. The EOG is quantified by calculating the size of the light peak in relation to the dark trough as a percentage, known as the Arden index. The Arden index is typically over 175% but can be abnormally low in conditions like Best Vitelliform dystrophy.
All rights reserved. No part of this publication which includes all images and diagrams may be reproduced, distributed, or transmitted in any form or by any means, including photocopying, recording, or other electronic or mechanical methods, without the prior written permission of the authors, except in the case of brief quotations embodied in critical reviews and certain other noncommercial uses permitted by copyright law.

Vitreoretinal Surgery Online
This open-source textbook provides step-by-step instructions for the full spectrum of vitreoretinal surgical procedures. An international collaboration from over 90 authors worldwide, this text is rich in high quality videos and illustrations.